Performance Report
Last updated: November 7, 2026
What this is
Reporting shows how your listings are performing on Audyence, from win rates and audience delivery to market benchmarks and ABM insights. You can filter it by date, campaign, advertiser, and listing.
Key takeaway: Go to Reports in the left navigation. Achiever gets limited access and Earner gets full access. Starter sees sample demo data only. Filters default to the last 6 months and apply to the whole report.
Important: Available on: Achiever (limited access) and Earner (full access). See How do I get access to Reporting? below.
What you can do in Reporting
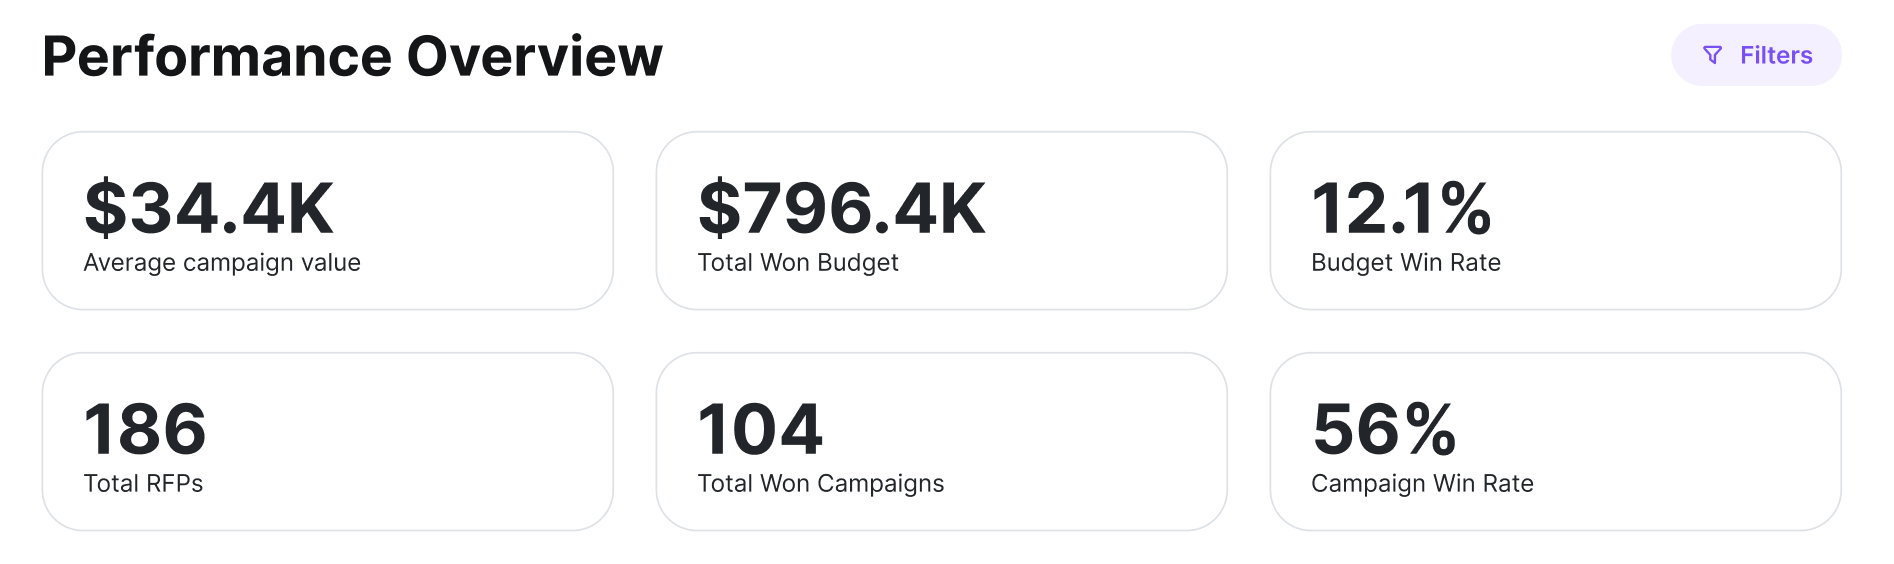
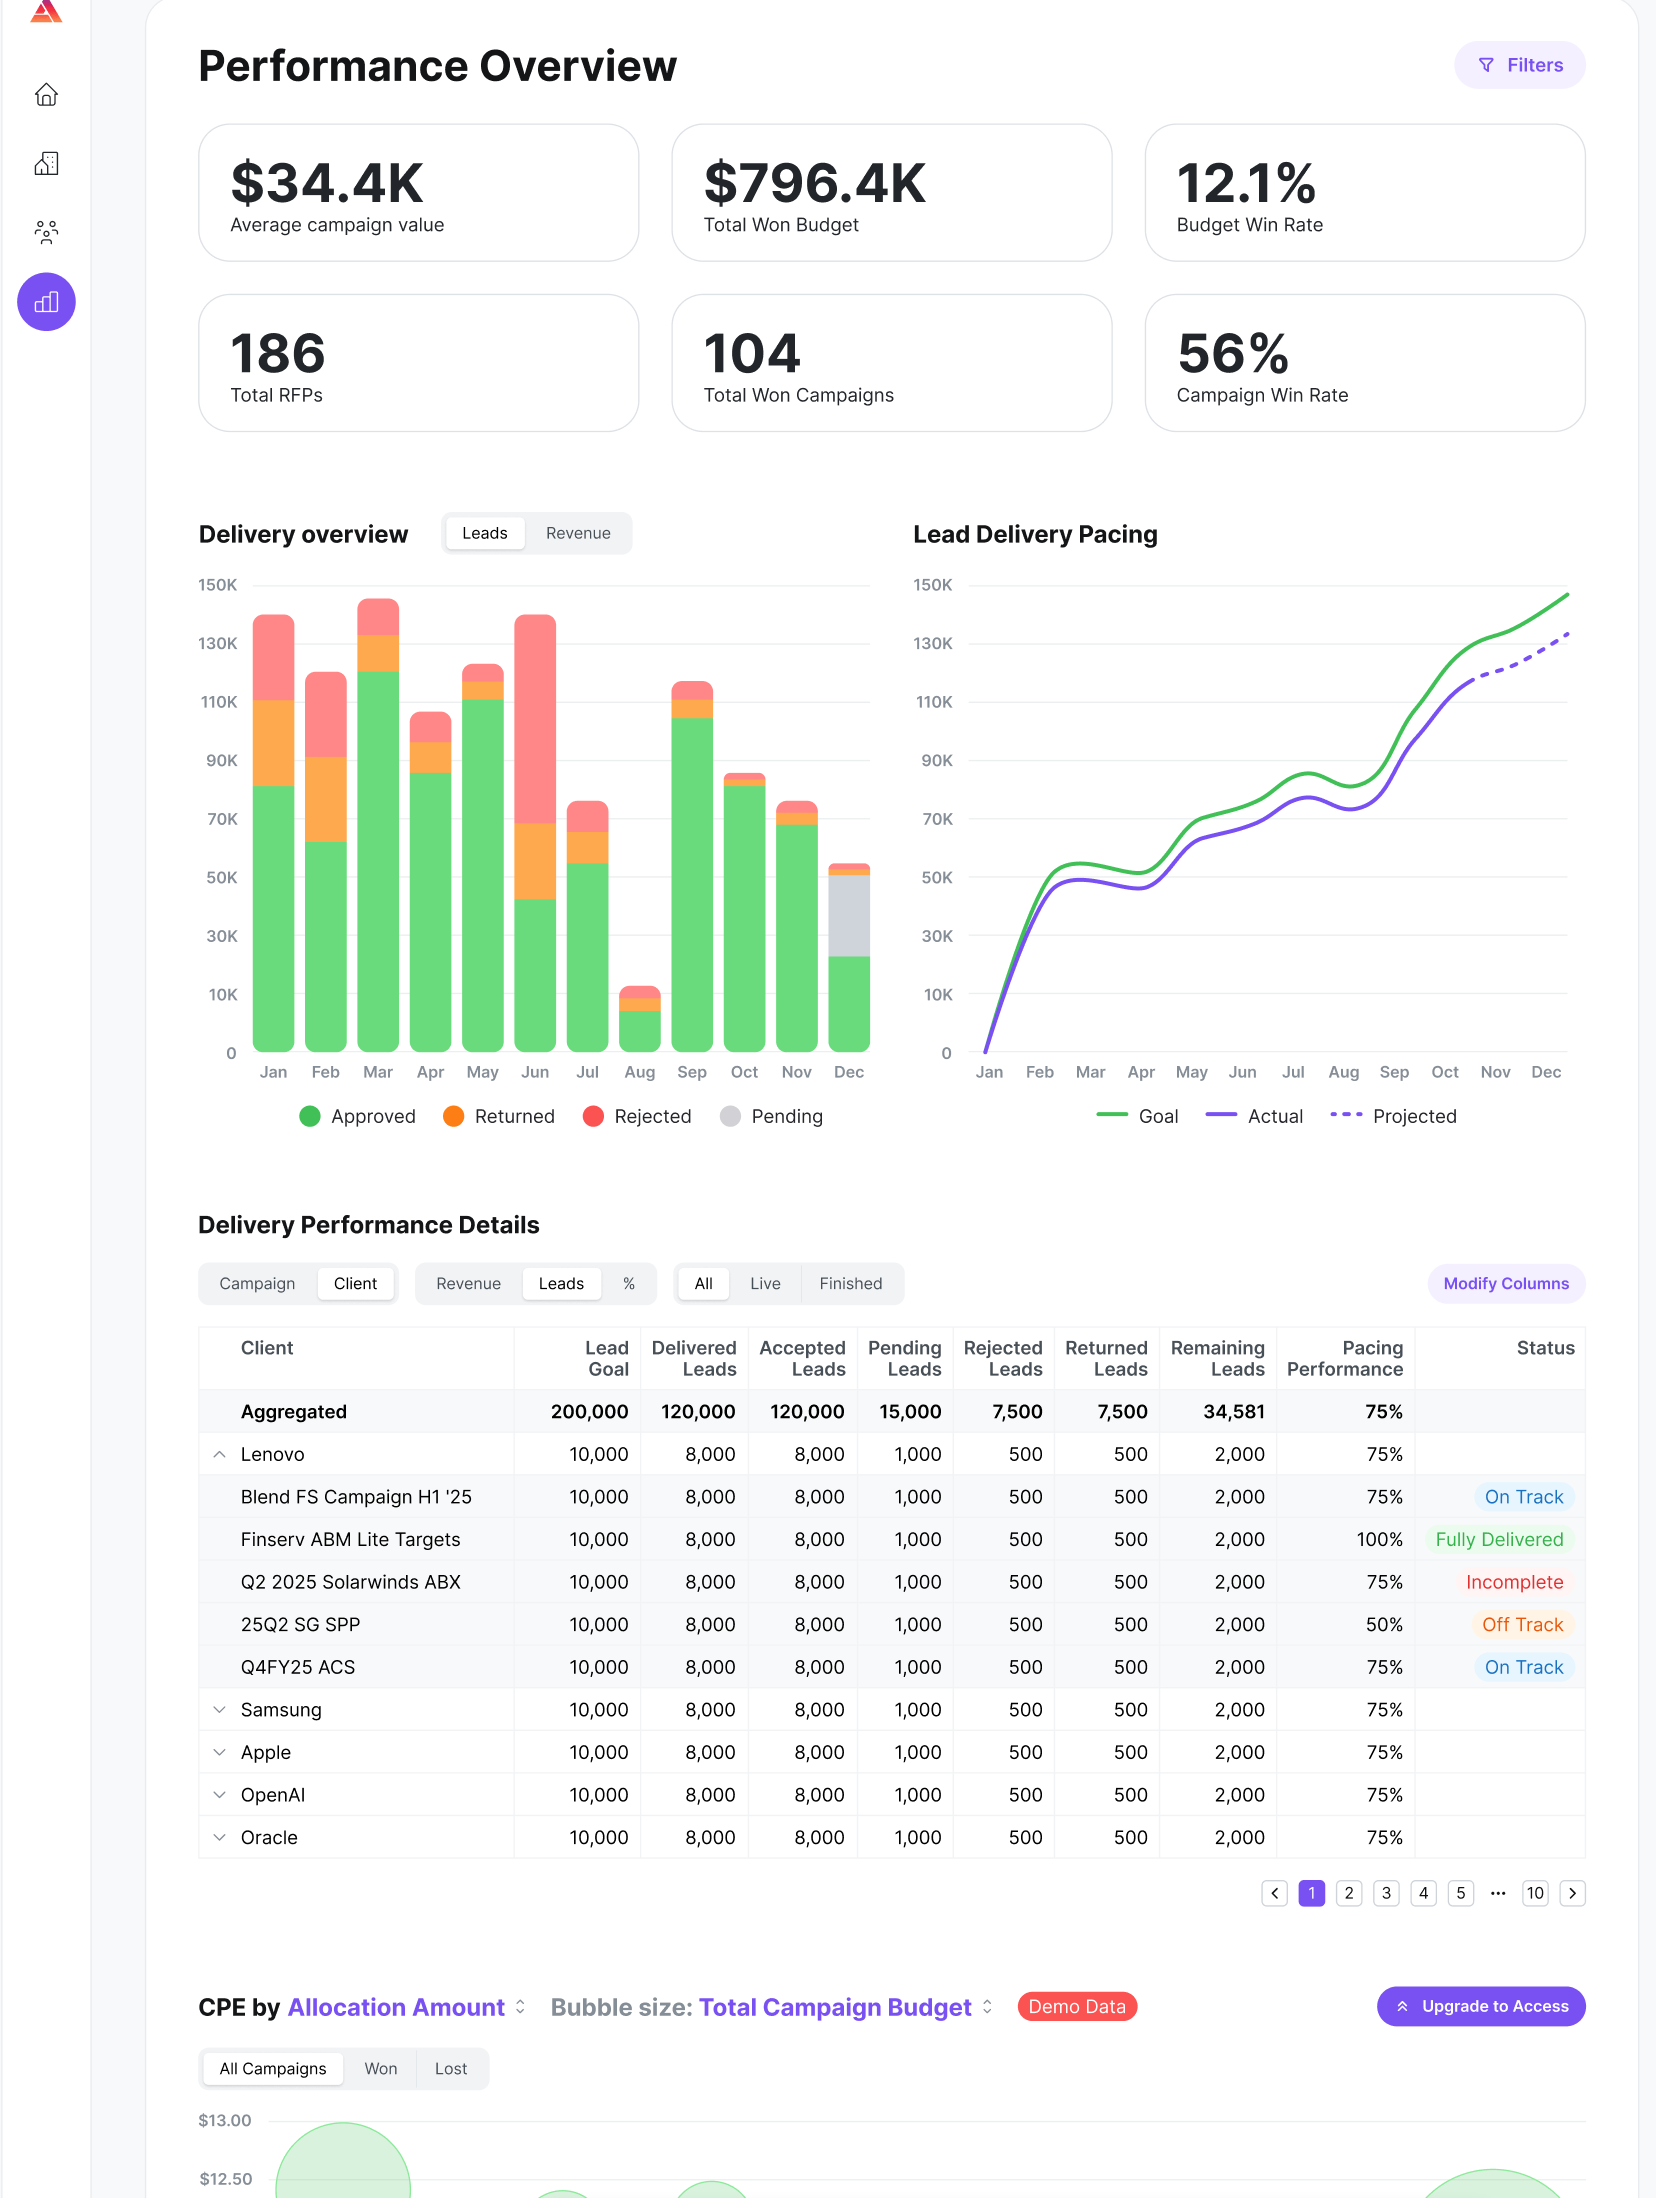
See your win rate, RFPs received vs. responded to, and average cost metrics at a glance.
See how your listings score on accuracy, quality, pacing, and renewal, and how you compare to the market average.
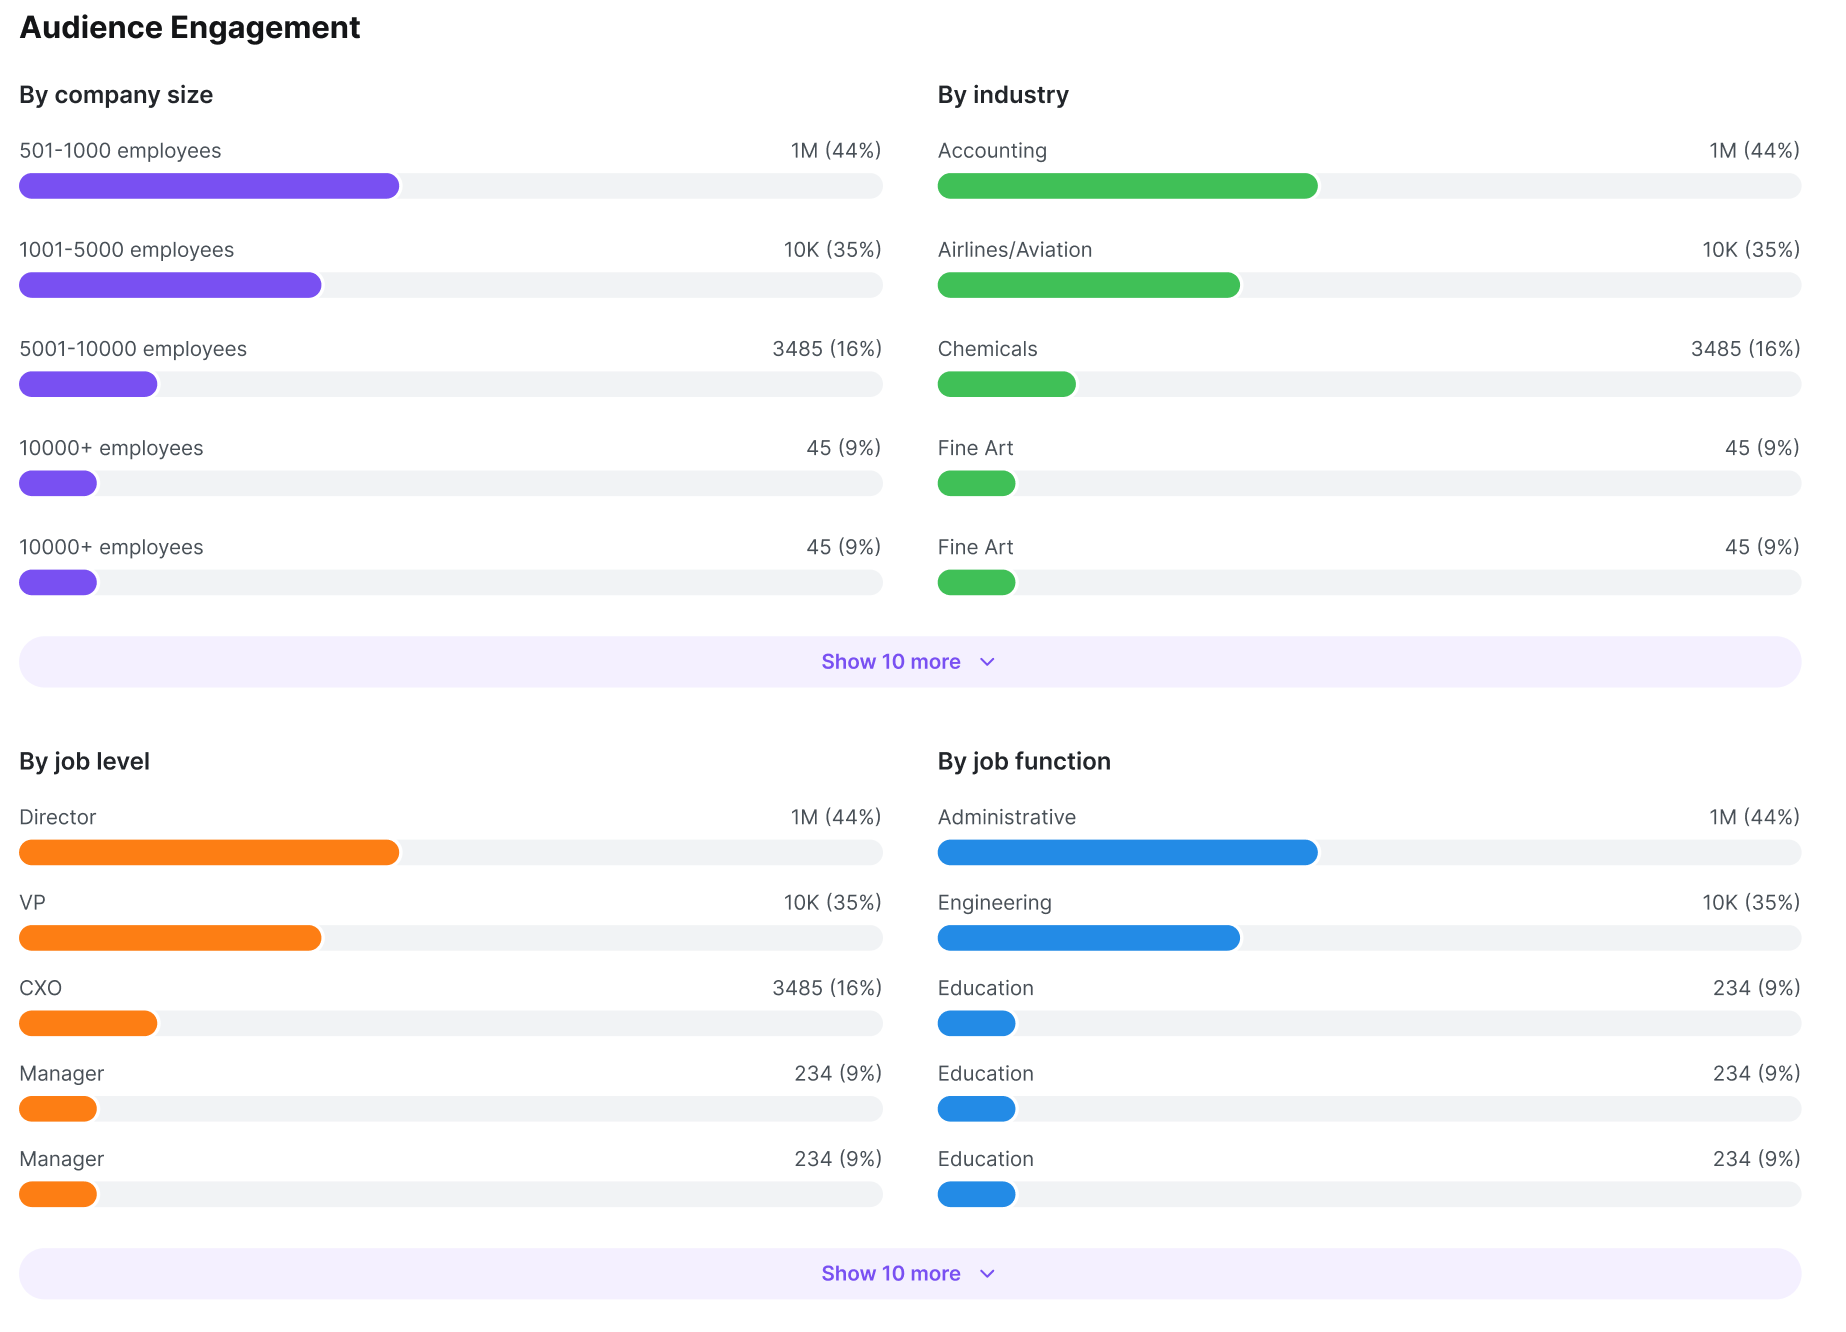
Break down your delivered audience by company size, industry, job level, job function, and geography.
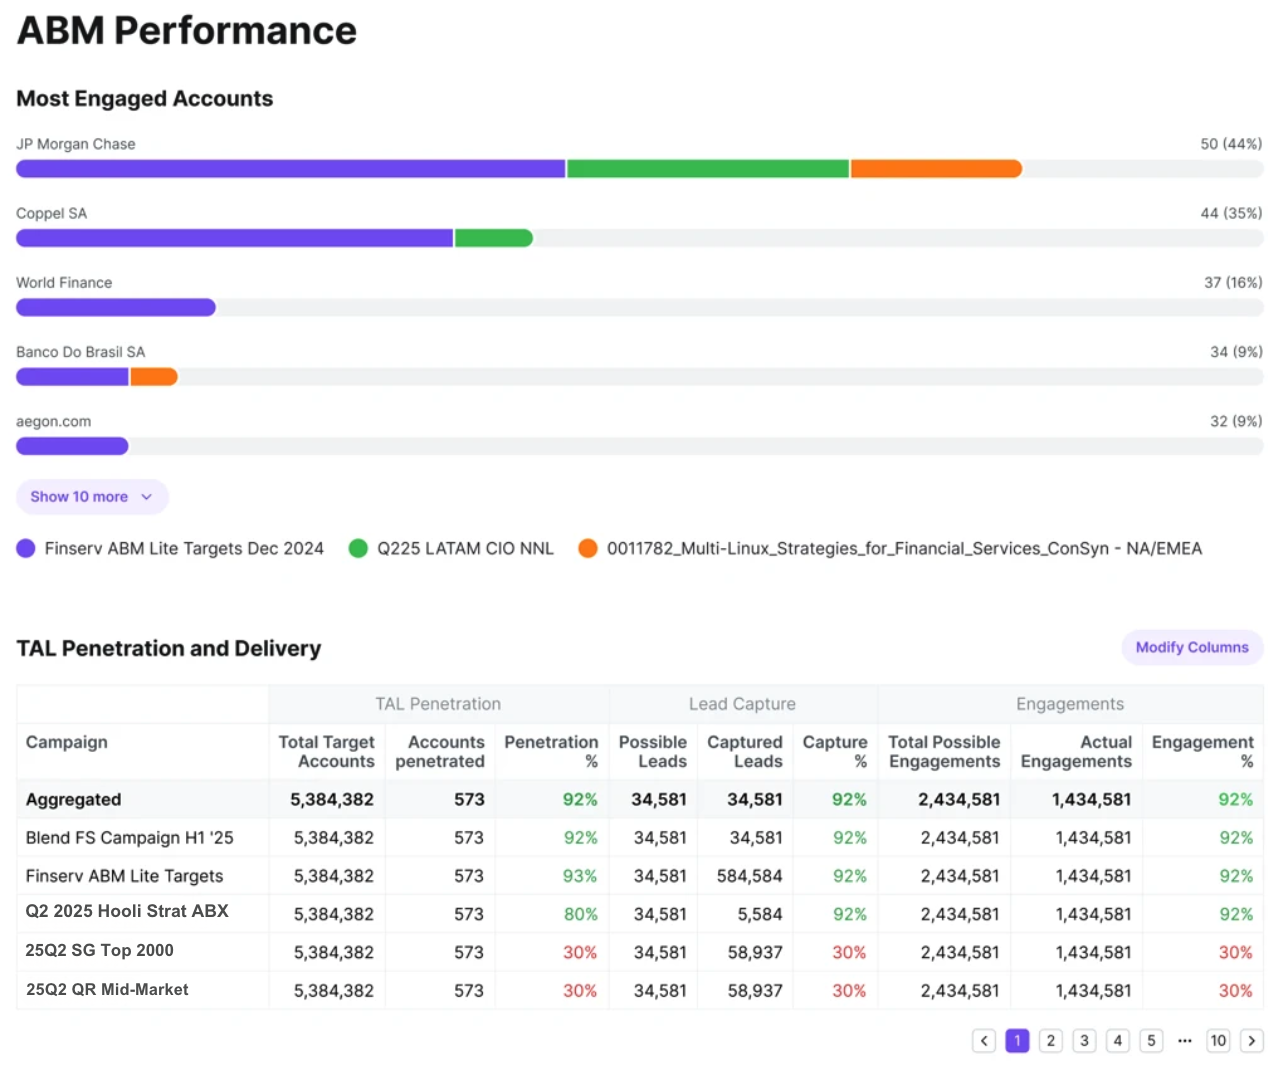
Review account-level reach and engagement for ABM campaigns.
How to open it
Log in to your account.
In the left navigation, select Reports.
The Performance Report loads automatically for your listings.
Understanding the report
Overview metrics
At the top, headline numbers sum up your performance for the selected period:
Metric | What it means |
|---|---|
Win rate | The percentage of bids where you got an allocation. |
Response rate | The percentage of RFPs you responded to within the 24-hour window. |
Average CPE and CPL | Your average prices. |
These update automatically when you change the filters.
Ratings
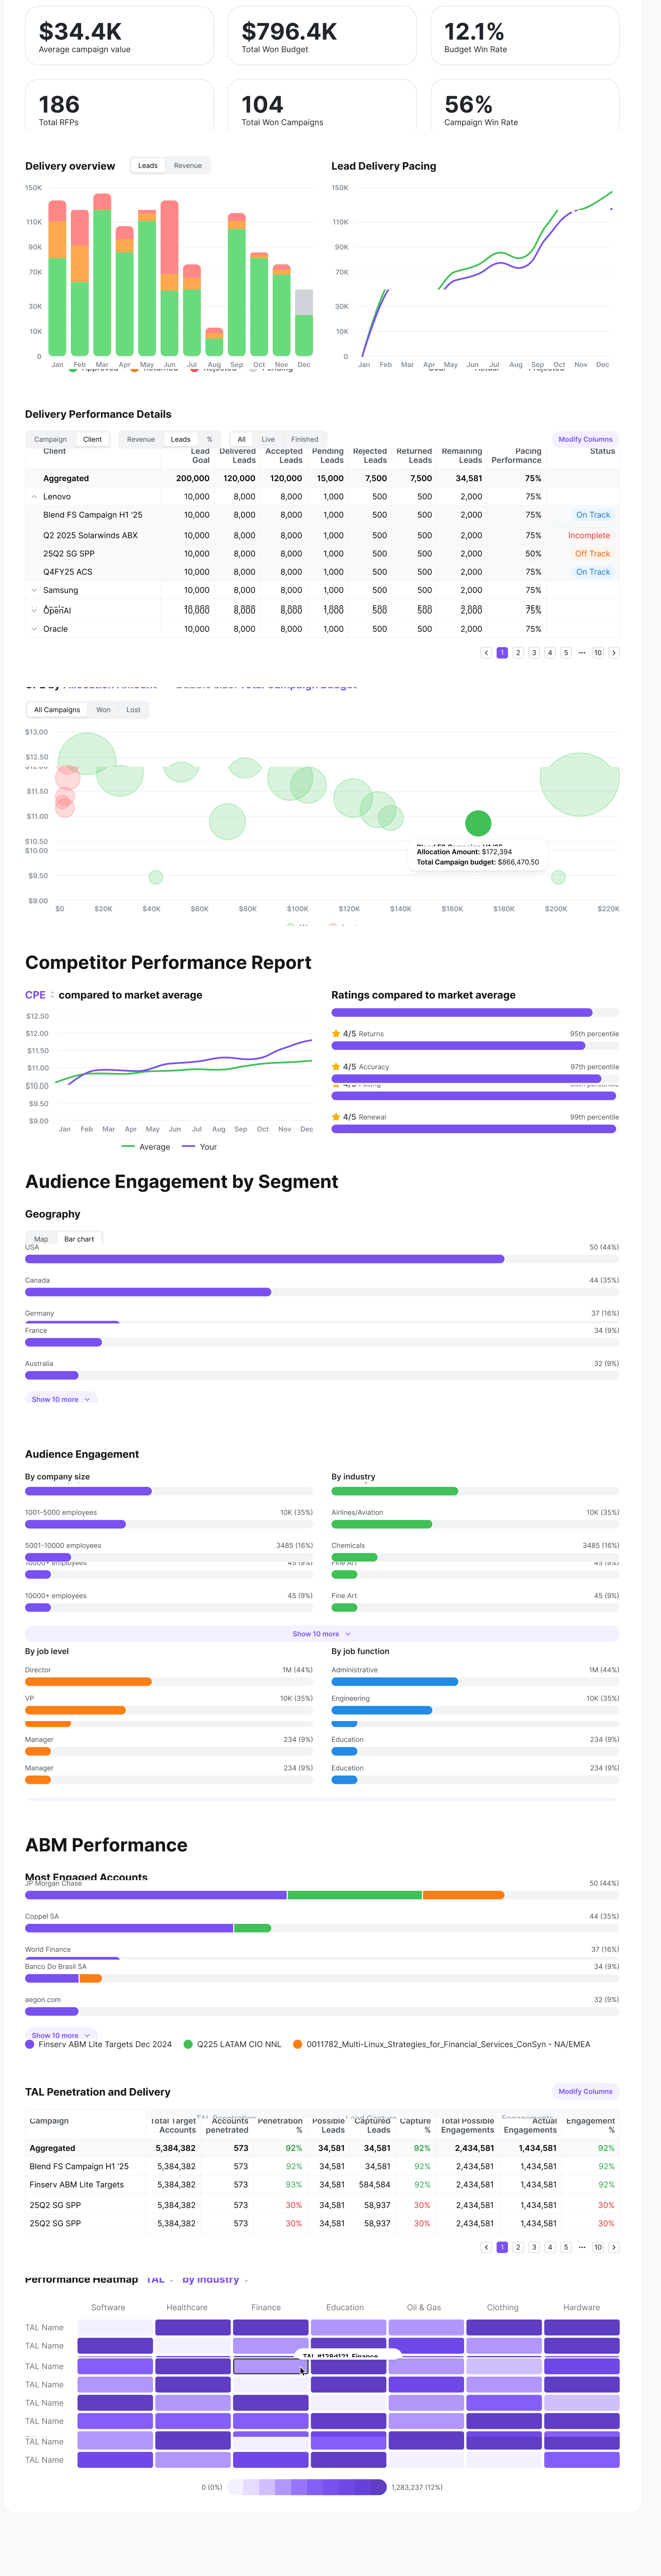
The Ratings section shows how your listings score across five dimensions (Overall, Accuracy, Quality, Pacing, and Renewal) as a value out of the maximum and as a percentage. If you select several listings, the chart averages across them. Dimensions with no data yet show N/A.
Expand the section to compare your scores with the anonymous market average for all publishers on Audyence, where 100% is the market average. If your rating meets or beats the average, it shows as 100%. If it's below, it shows your actual percentage. No individual publisher's data is shown.
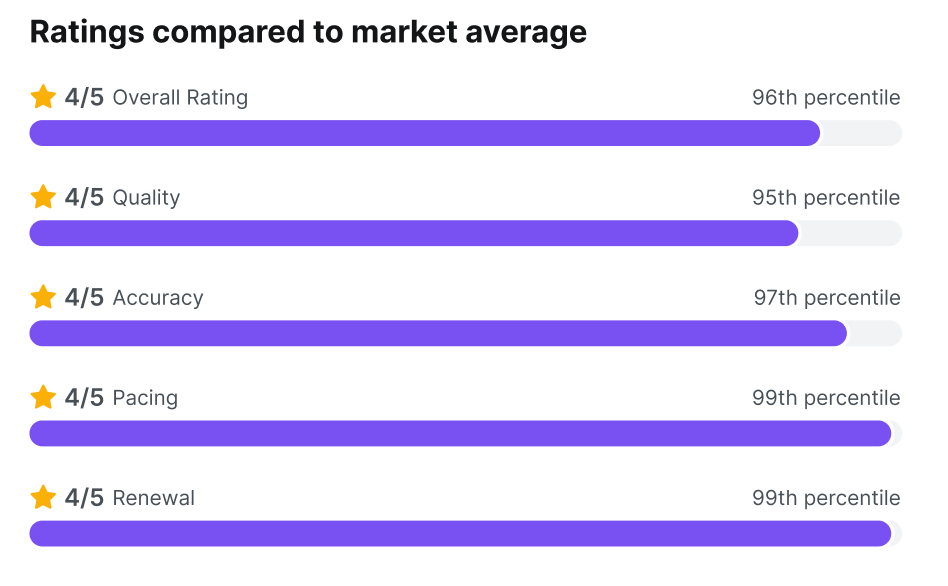
Tip: If you fall below the 75th percentile, work with your team to understand that metric and how to adjust your approach to stay competitive.
Audience engagement by segment
This section breaks down approved engagements from your delivered leads across five dimensions: Company Size, Industry, Job Level, Job Function, and Geography.
Only approved engagements count. Pending, rejected, and invalid engagements are left out.
Each dimension shows the engagement count and percentage of the total for each value.
If a dimension has more than five values, the top five show by default, with Show more to see the rest.
Leads with incomplete data are grouped under Unknown.
Company Size uses a fixed order. All other dimensions are sorted by engagement volume, highest first.
ABM performance
If your campaigns use a Target Account List (TAL), this section shows account-level engagement and reach for the accounts you're delivering against.
Most Engaged Accounts ranks account domains by total approved engagements, with each bar split by campaign. The most engaged account is at the top. If there are more than five accounts, the top five show with show more.
TAL Penetration and Delivery shows, for each campaign, how many targeted accounts you've reached with at least one approved lead (Accounts Penetrated), the penetration percentage, captured leads, and actual engagements.
Penetration color | Range |
|---|---|
Green | Above 80% |
Orange | 50% to 80% |
Red | 50% or below |
Filters
You can filter the whole report by:
date range
campaign
advertiser
listing
All numbers, charts, and tables update automatically when filters change. Past data is included as soon as it falls within your selected date range.
Note: Filters default to a 6-month view.
Frequently asked questions
How do I get access to Reporting?
Publishers on limited trials or the Starter plan can upgrade to get the reporting modules that fit their needs. The table below shows what each plan includes.
Plan | Report components included |
|---|---|
Starter | Sample demo data for exploring only. No real account data is shown on this plan. |
Achiever | Essentials: Performance Overview, Delivered Review, Lead Delivery Pacing, Delivered Performance Details. |
Earner | Full access: Performance Overview, Delivered Review, Lead Delivery Pacing, Delivered Performance Details, CPE Review, Competitor Performance Report, Audience Engagement by Geography, by Company Size, by Industry, by Job Level, and by Job Function, ABM Performance: Most Engaged Accounts, TAL Penetration and Delivery, Performance Heatmap. |

Can I see data from campaigns that ran before Performance Reporting launched?
Yes. All your past campaign data was loaded in, so there's no setup needed.
Can I export my data?
No, export isn't available.
Why does my win rate look lower than expected?
Win rate is allocations received divided by total RFPs you bid on. If you responded to RFPs but didn't get an allocation, those bids still count. Better listing quality scores, accuracy, and competitive pricing are the most reliable ways to raise your win rate over time.
Can I see other publishers' data or advertiser spend?
No. The Performance Report shows only your own delivery data. Market benchmarks are global and anonymous: individual publishers aren't identified. Advertiser spend and platform financials aren't visible.
What does the Beta label on TAL Penetration and Delivery mean?
That section is still being refined. Its calculations may change, so it's labeled Beta.
Need help?
Tip: Contact pubsupport@audyence.com for landing page reviews, campaign questions, lead status updates, platform feedback, or anything else.